Hey there, everyone! What an awesome start to the new season of Game of Thrones. So much so that the ratings news came out earlier than expected, but we need not have fretted — Luka had it all covered! Yesterday’s post puts the numbers into perspective, so today I’m mostly just adding the visual perspective as well. Yes, it’s again time for a ratings graph!
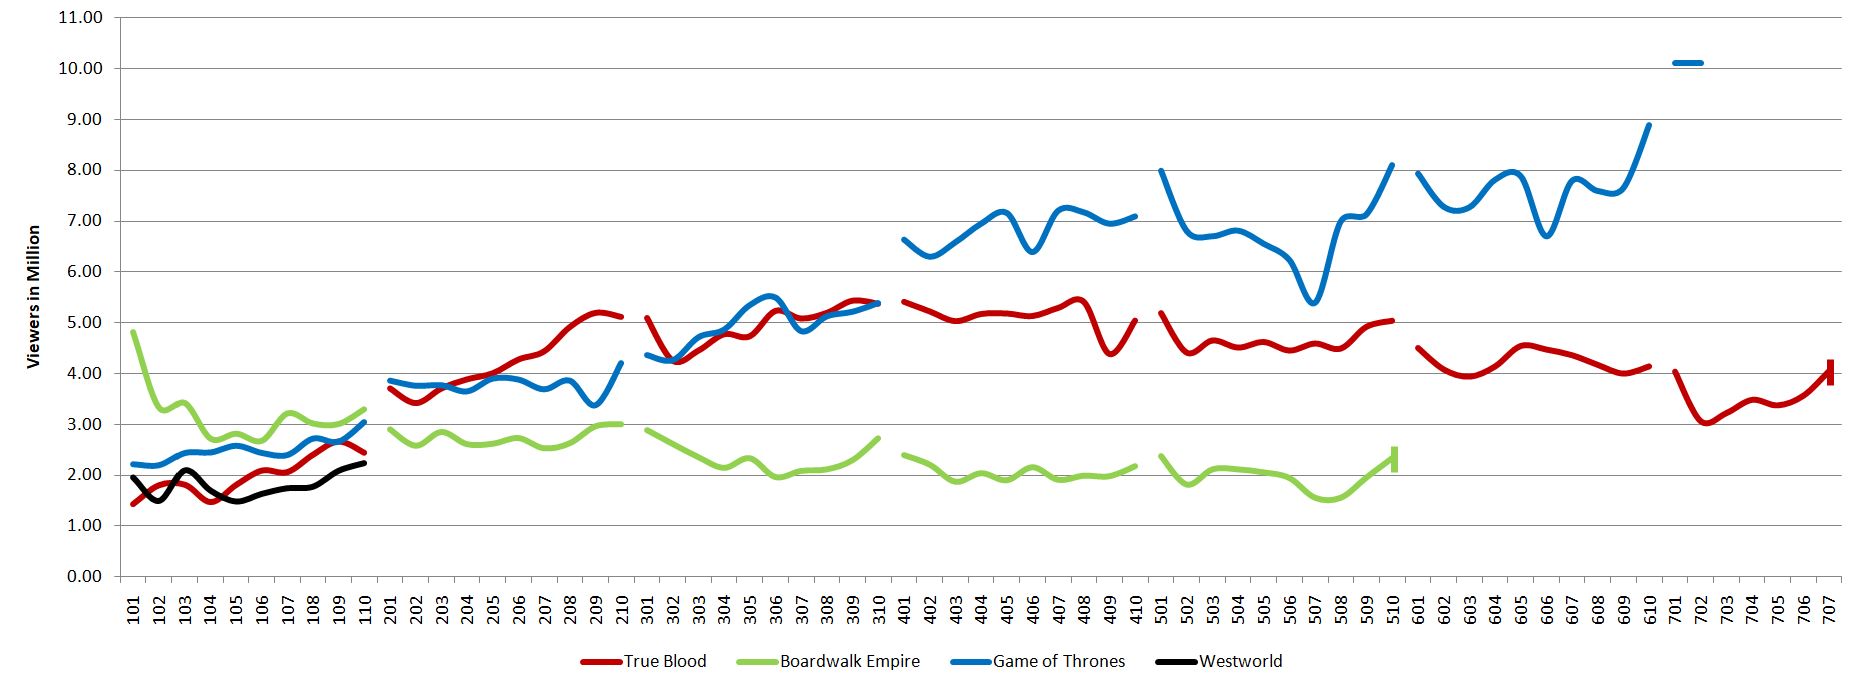
As has become standard over the years, we will be comparing the live ratings of the first airing of each GoT episode to those of other comparable flagship HBO series, namely True Blood, Boardwalk Empire, and this time around also Westworld (visit our sister site, if you are a fan and haven’t done so yet). The runs of other shows of different season length have been compressed to line up with that of Thrones. Yes, I know this is not a scientific graph, but I still believe it is a useful visualization that gives a good overview.
The previous season finale came close to 9 million, but not exceeding it, while this season’s opening added over a million first-airing viewers, which broke the 10 million milestone. The value of 10.1 million is indicated by the short blue dash in the graph above. The other number, 16.1 million viewers across all platforms on the premiere night is also significant — remember that last season’s average total viewers per episode counting all the repeats and means of watching the show in the weeks after the initial airing was last reported at 23 million. I’m pretty confident that we’re on a good way to break this record (which means most to HBO) once again this year.
The post Game of Thrones ratings overview – S7 edition appeared first on Watchers on the Wall.
Via http://watchersonthewall.com
No comments:
Post a Comment